
Case Study · Events & Hospitality
How Hornsby After Dark Reached 1.17 Million Facebook Views This Year
As social media partner for Hornsby After Dark, OZ Media Digital helps connect locals with the precinct’s markets, venues and evening events. Facebook views are up 40% year to date, and video is doing more of the work than ever.
Marketing a whole precinct, not a single business
Hornsby After Dark promotes the evening side of Hornsby and Waitara: twilight markets, live music, food stalls, workshops and seasonal nights out, across a precinct of more than 140 local businesses.
That makes social media a different job from promoting one shop. Every week there’s a different event, a different venue and a different reason for locals to come out. The content has to keep people interested in the precinct as a whole, while giving each event enough of a push to get people through the door.
Our objective: build a local audience that watches, shares and follows Hornsby After Dark, so every new event starts with people already paying attention.
What the strongest posts have in common
Looking back over a year of Instagram content, the posts that travelled furthest fall into three groups. None of them is a single format, which is the point: the account works because it mixes them.
Market experience Reels
Short videos that put you in the middle of a market night. A Twilight Market Reel reached about 31K views and was shared 107 times.
Occasion-led posts
Content tied to a moment people already care about. A Mother’s Day “give Mum the night off” post reached about 24K views, and the birthday Reel brought in 84 follows.
Practical event graphics
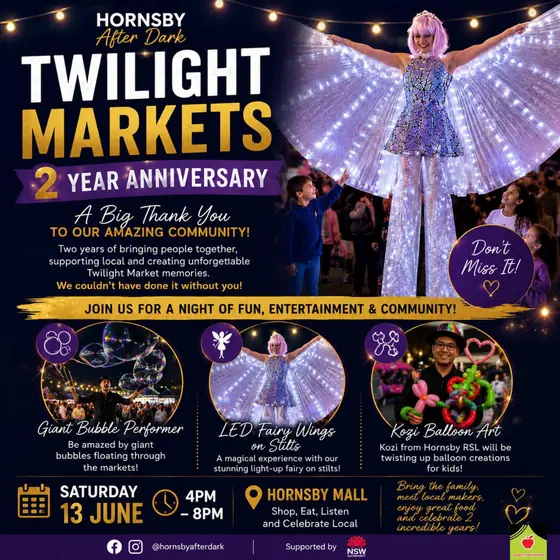
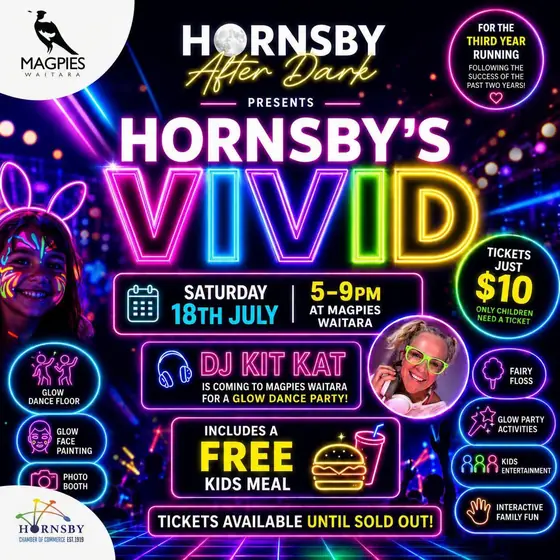
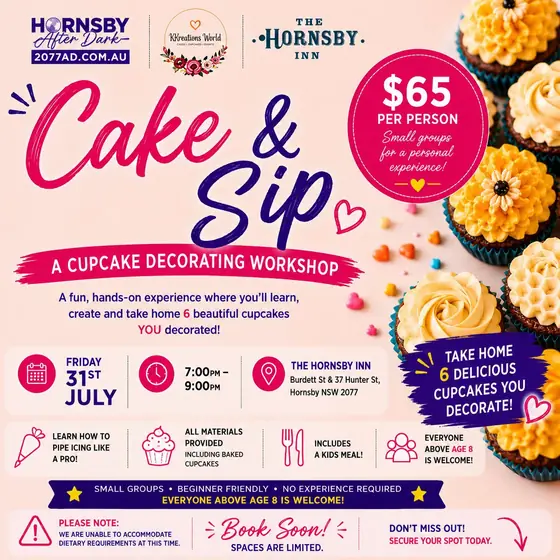
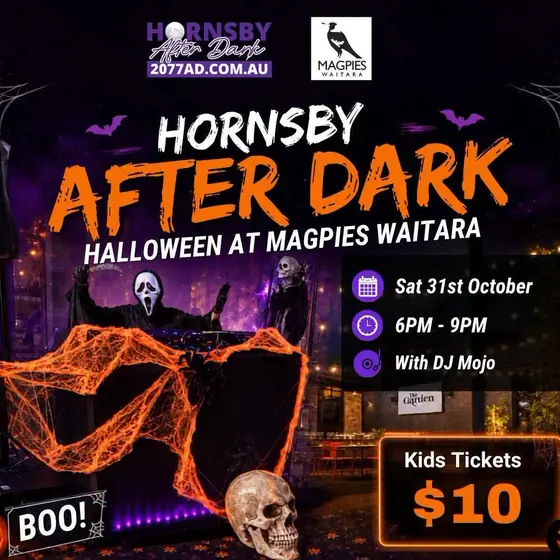
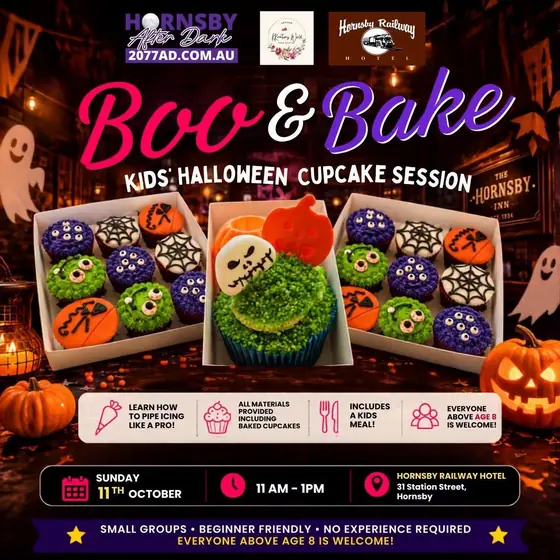
Clear flyers with the date, time and price. One event graphic was shared 93 times, so flyers still earn their place next to video.
A bigger year, and much more video watched
Facebook is where Hornsby After Dark’s reach is largest. Year to date, views are up 40% and engagement is up 33%. Over the latest 90 days, total views dipped by about 8%, but people watched far more of the video: Reel views nearly doubled and watch time more than tripled.
This year: 1 Jan to 14 Nov 2026
- ViewsUp 40%1,172,884
- EngagementUp 33%50,954
- New follows580 follows, 58 unfollows+522 net
- Total followers2,749
- Messaging conversations startedUp 17%35
Latest 90 days: 17 Aug to 14 Nov
- Reel viewsUp 96%101,734
- 3-second video viewsUp 229%46,387
- Watch timeUp 258%8d 12h
- 1-minute video viewsUp 956%, from a small base475
- Messaging conversations startedUp 63%13
Most-viewed Facebook Reels, latest 90 days
Source: Meta Business Suite insights for the Hornsby After Dark Facebook Page, captured 15 November 2026. Percentage changes are Meta’s own comparison with the previous period of the same length. Watch time is total time watched, not a count of people. The 90-day views panel shows 319,129 views; the overview card shows 319,226 for the same window.
A smaller account that keeps growing its following
Instagram is the smaller of the two channels. Over its latest 90-day window (16 Aug to 13 Nov), the account gained 71 follows and lost 16, for 55 net new followers and reported growth of 6.8%, to 874 followers.
| Instagram post (one-year view) | Posted | Views | Shares | Also |
|---|---|---|---|---|
| “The Spring Edition of…” | 11 Sep | 32K | 2 | 28 likes, 4 follows |
| “Born to: wander the Hornsby T…” (market Reel) | 31 Jul | 31K | 107 | 72 likes, 7 saves |
| “Give Mum the night off this M…” | 24 Apr | 24K | 33 | 68 likes, 9 saves |
| “No cooking, no dishes, just pu…” | 30 Mar | 22K | 61 | 80 likes, 6 saves |
| “It’s almost our birthday and y…” | 29 May | 21K | 85 | 140 likes, 84 follows, 25 saves |
| “Spooky season starts NOW!…” | 2 Oct | 19K | 35 | 69 likes |
Source: Instagram professional dashboard, content ranked over one year, captured November 2026. View counts are rounded by Instagram. Captions are shortened exactly as the dashboard shows them. Some of these posts sit outside the 90-day follower window above.
Not every number went up, and that’s useful too
We’d rather show you the whole report than the best week of it. A few figures moved the wrong way in the latest reporting windows:
The reports alone can’t tell us why recent views fell. Event calendars, posting volume and Meta’s distribution all change from one period to the next, so we’re treating it as a question to investigate rather than a cause to guess at.
The clearer lesson is that attention isn’t the same as action. Facebook views and engagement grew this year while Page visits fell, and very few Instagram visitors tapped through to the website. That points to the next job: clearer event calls to action and direct links people can actually use.
An older, more local audience than the name suggests
“After Dark” might sound like a young nightlife brand. The audience data says otherwise, which changes what kind of content is worth making.
That’s why the content leans into family-friendly nights, food, workshops and early-evening plans, not just late-night entertainment. Instagram also reports followers as most active on Monday to Wednesday evenings, between 6pm and 9pm, which gives us a posting window to test.
Source: Instagram follower insights (90-day report) and Facebook Page audience insights (all-time), captured November 2026. Sydney is a city-level figure, not proof of a Hornsby postcode.
Event nights, creative and the people behind them
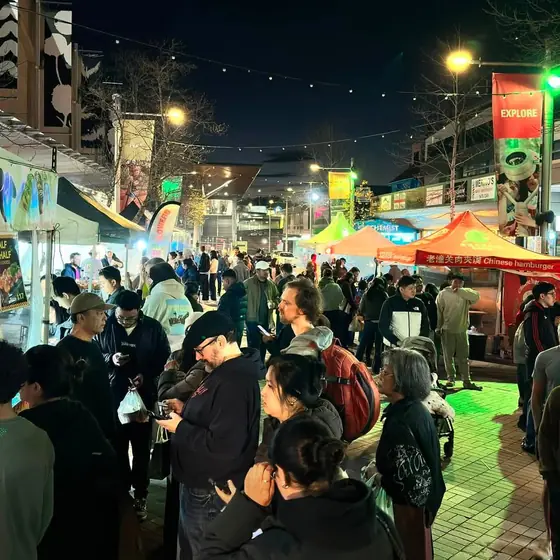
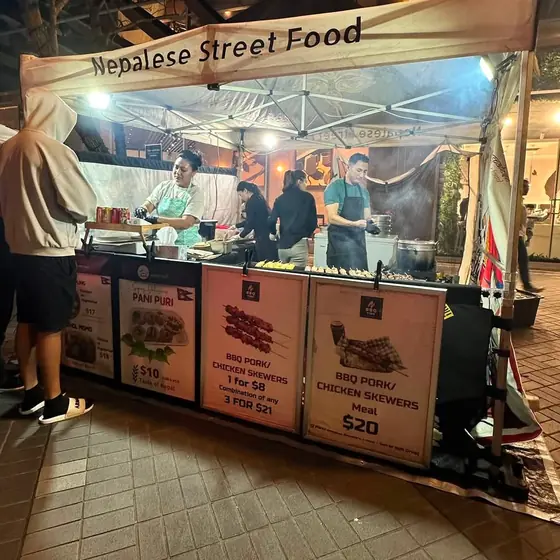
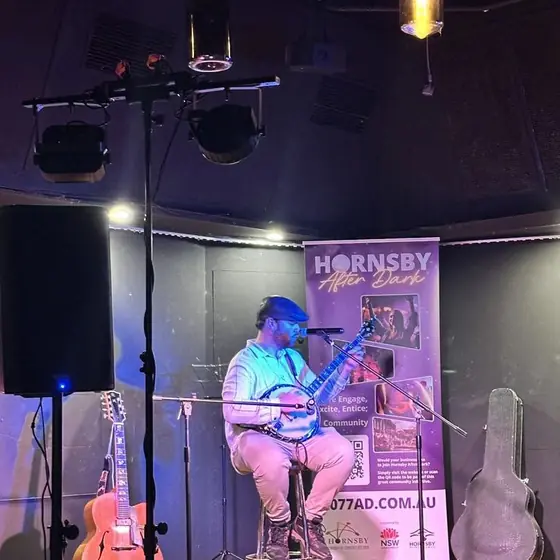
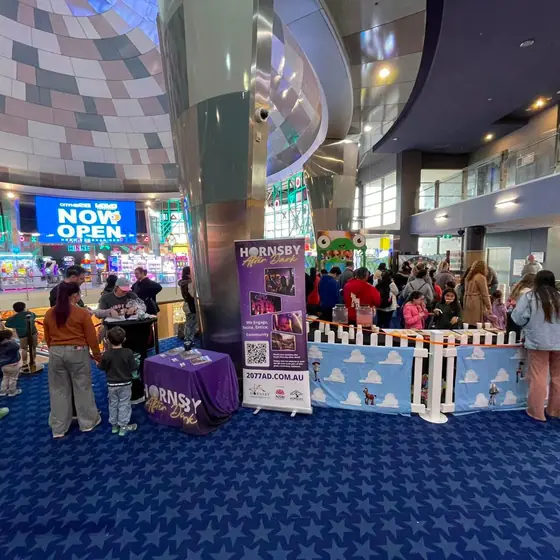
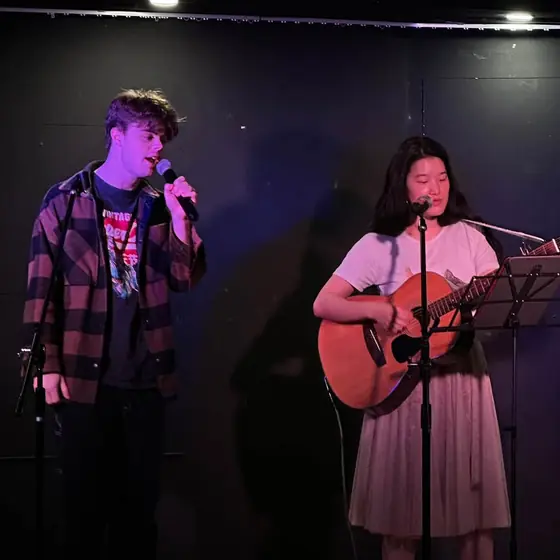
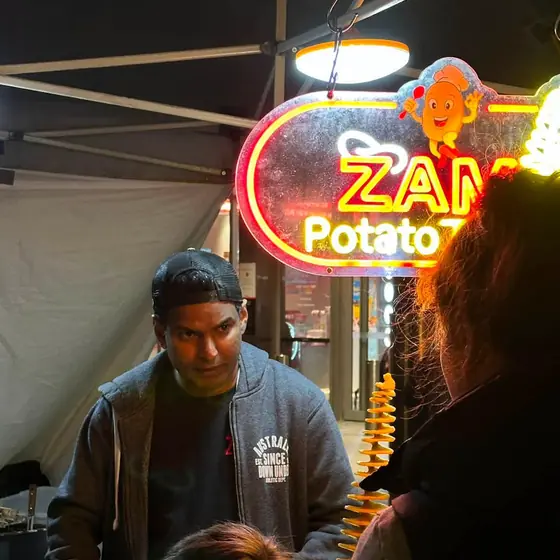
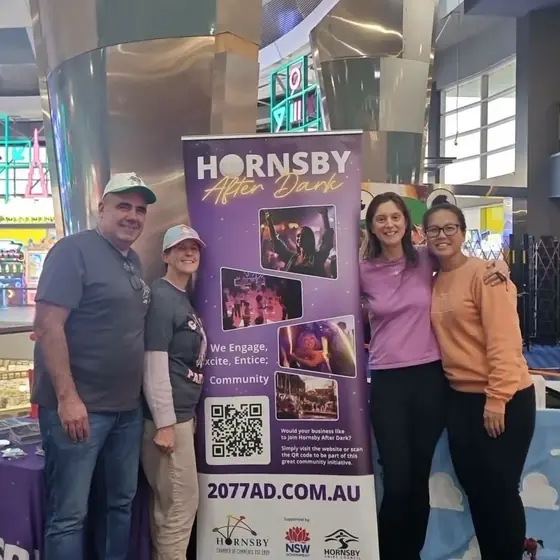
Photography and event creative from the Hornsby After Dark account. Swipe through the gallery below.
Scroll or swipe →
Turning attention into people at events
The reports point to a clear set of next steps for the account:
- More market experience and occasion-led Reels
- Keep the practical event graphics people share
- Family, food and early-evening content for a 35 to 54 audience
- Clear event calls to action with direct links
- Test posting in the Monday to Wednesday 6pm to 9pm window
- Track link clicks, venue collabs and event turnout in one report
Running events or promoting a local precinct?
Whether it’s a market, a venue or a whole shopping strip, social media works best when the content gives locals a reason to show up. We plan, create and report on Facebook and Instagram content for local businesses and community programs across Hornsby and the North Shore.
Related reading
Social Media Strategy for Local Business: 2026 Guide
Why most local business social content fails, and the four strategic shifts that actually turn followers into enquiries.
Read article: Social Media Strategy for Local Business: 2026 Guide
Where Should I Post My Business on Social Media?
A platform-by-platform breakdown of Facebook, Instagram, TikTok and LinkedIn for Australian small businesses.
Read article: Where Should I Post My Business on Social Media?
Do I Really Need to Hire a Social Media Manager?
The honest signs it's time to stop DIY-ing your social media, and how to choose a freelancer, agency or in-house hire.
Read article: Do I Really Need to Hire a Social Media Manager?Results shown are specific to each client, business and time period, taken from the client's own reports or from advertising platform data. They are not a guarantee of future results.